As I've already said on other pages,
I'm a prime number junky.
Prime numbers are counting (whole) numbers which can't be
divided evenly except by themselves or by the number 1. So for example,
the primes between 1 and 30 are: 2, 3, 5, 7, 11, 13, 17, 19, 23 and
29. All the other numbers are evenly divisible by a previous counted number
(other than 1).
I read somewhere that there were "arbitrarily large"
consecutive spaces in the number series that contain no primes. By
"arbitrary" is meant any large number you care to name. I found that
rather hard to believe. Primes are prolific and generally plentiful in
any number range I've ever looked at -- up into the quadrillions, where my 1.8
MHz PC can still clank along (albeit slowly). I'm no mathematician, so I can't
fathom the deeper aspects of number theory. Nor can I understand
complicated math proofs. But as an engineer I can appreciate data. So I decided to
develop some data sets which explore this notion of large "prime-free
regions".
Let's set up a table that is 30 counting numbers wide, with
each cell in the table representing a consecutive counting number. Row 1
will have numbers 1 through 30, row 2 will be 31 through 60, row 3 will be 61
through 90, and so forth. You'll find that after the first row, there are only 8 columns that contain prime numbers:
columns 1,
7, 11, 13, 17, 19, 23 and 29. You can plot this 30-wide table
graphically, lighting up the number cells that are prime. Looking down
through the resulting rows in this
table, each row will have a certain number of prime cells illuminated.
|
Row 1 |
1 |
2 |
3 |
4 |
5 |
6 |
7 |
8 |
9 |
10 |
11 |
12 |
13 |
14 |
15 |
16 |
17 |
18 |
19 |
20 |
21 |
22 |
23 |
24 |
25 |
26 |
27 |
28 |
29 |
30 |
|
Row 2 |
31 |
32 |
33 |
34 |
35 |
36 |
37 |
38 |
39 |
40 |
41 |
42 |
43 |
44 |
45 |
46 |
47 |
48 |
49 |
50 |
51 |
52 |
53 |
54 |
55 |
56 |
57 |
58 |
59 |
60 |
|
Row 3 |
61 |
62 |
63 |
64 |
65 |
66 |
67 |
68 |
69 |
70 |
71 |
72 |
73 |
74 |
75 |
76 |
77 |
78 |
79 |
80 |
81 |
82 |
83 |
84 |
85 |
86 |
87 |
88 |
89 |
90 |
|
Row 4 |
91 |
92 |
93 |
94 |
95 |
96 |
97 |
98 |
99 |
|
etc… |
|
|
|
|
|
|
|
|
|
|
|
|
|
|
|
|
|
|
|
Row 5 |
|
|
|
|
|
|
|
|
|
|
|
|
|
|
|
|
|
|
|
|
|
|
|
|
|
|
|
|
|
|
|
Row 6 |
|
|
|
|
|
|
|
|
|
|
|
|
|
|
|
|
|
|
|
|
|
|
|
|
|
|
|
|
|
|
When you get down aways into the table, some rows will have no cells lit up
-- which means that there
were no numbers in the 30-wide row that were prime numbers. The rest
will have anywhere from 1 to 7 cells lit up. (It's of some passing
interest to find that no rows have all 8 "prime-active column" boxes
lit up. I don't know why that is, but I suspect it's an outcome of
factor "sieve lines" that cross diagonally through the table.) Since the frequency of
prime numbers does indeed "peter out" somewhat as you go higher and higher
(see note below),
you'd expect that the "zero" rows would become more and more frequent as you
go higher and higher in your count. That is in fact the case.
Suppose we look at the ratio of prime number "hits" in
consecutive 30-number blocks -- corresponding to each individual row in our
modulo-30 number table -- relative to the number of 30-number blocks that have
no hits at all. That is, we'll calculate the ratio of the number of
prime hits in all
rows to the number of rows that have no hits. We'll select a sizeable
range of numbers (table size) to establish these ratios -- let's use ranges of 1,500,000
consecutive counting numbers -- 30-column tables that are 50,000 rows tall..
So here's the drill: I look at the number of prime hits
in each of the 30-number rows in my first 1,500,000-number table, then
the next 1,500,000-number table, then the next, and the next, and so forth.
After getting these initial data on the first few tables, I can skip ahead to
tables starting with much larger numbers -- making sure I keep the same
modulo-30 order -- and do the same, up to (in my study exercise) 15,000,000,000.
In each table or "block" of 1,500,000 numbers, I interrogate a total of
50,000 rows (1,500,000/30). I count the number of rows that have 0, 1,
2, 3, 4, 5, 6, or 7 primes lit up. Then I ratio those counts
according to the "reference number" of the "0" row count. I end up with
the following data:
|
Start point (R=1.5 X 10⁶) |
0 Hits/0 Hits |
1 Hit/0 Hits |
2 Hits/0 Hits |
3 Hits/0 Hits |
4 Hits/0 Hits |
5 Hits/0 Hits |
|
1 |
1.0 |
3.7 |
5.6 |
4.4 |
2.10 |
0.54 |
|
1+1R |
1.0 |
3.2 |
4.1 |
2.8 |
1.00 |
0.23 |
|
1+2R |
1.0 |
2.9 |
3.6 |
2.3 |
0.87 |
0.17 |
|
1+3R |
1.0 |
2.8 |
3.4 |
2.1 |
0.76 |
0.16 |
|
1+4R |
1.0 |
2.8 |
3.3 |
2.0 |
0.69 |
0.14 |
|
1+10R |
1.0 |
2.6 |
2.8 |
1.6 |
0.50 |
0.09 |
|
1+20R |
1.0 |
2.5 |
2.5 |
1.3 |
0.41 |
0.07 |
|
1+50R |
1.0 |
2.2 |
2.1 |
1.0 |
0.31 |
0.05 |
|
1+100R |
1.0 |
2.1 |
1.9 |
0.9 |
0.25 |
0.03 |
|
1+200R |
1.0 |
2.0 |
1.7 |
0.8 |
0.21 |
0.02 |
|
1+500R |
1.0 |
1.9 |
1.5 |
0.7 |
0.16 |
0.02 |
|
1+1000R |
1.0 |
1.9 |
1.4 |
0.6 |
0.13 |
0.018 |
|
1+10000R |
1.0 |
1.6 |
1.1 |
0.4 |
0.07 |
0.010 |
You'll notice that all the 1, 2, 3, 4, and 5-hit ratios are declining
relative to the "0" hit counts, given as a normalized reference. (I've not
shown the 6, 7 and 8 hit columns since 6 and 7 are miniscule ratios, and there
are no rows at all with 8 primes in the "prime-active" columns.)
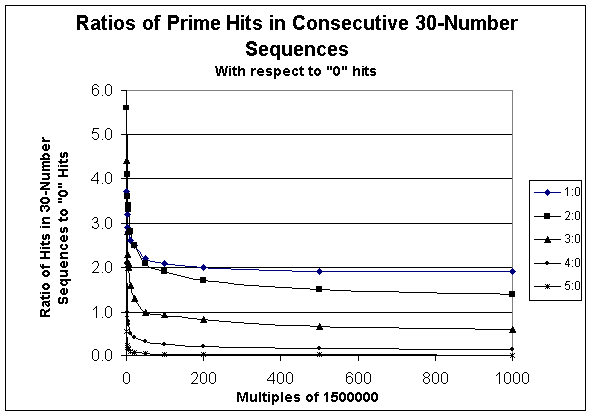
Let's plot the results graphically:

You can see that the ratios decline as we get higher and
higher in the number series. They decline fast in the early ranges and
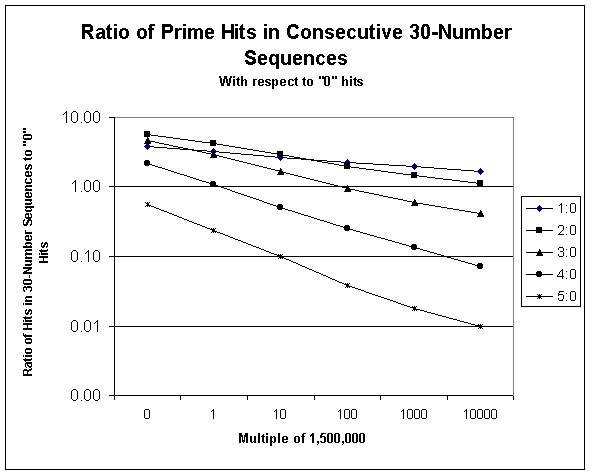
much slower later on. To get a better handle on this, let's replot the
chart on a logarithmic scale. I'll just plot the 10X multiples of 1.5
million to make this a true "log-log" chart:

This is as cool as a snowcone at the South Pole! The ratio lines
descend in a straight-line fashion, plotted on a logarithmic scale. Now,
here's the thing: Since the slopes of all the ratio lines are heading
downwards, there must be a point somewhere along the far, far rightward portion of
this graph where all the lines will eventually hit zero. And if the
ratios of the quantity of all the rows with prime hits to the quantity with
zero prime hits become zero, then all 50,000 30-wide number rows in that
interrogated range must have zero prime hits. So at that far-distant
point, there will be 1,500,000 consecutive numbers that contain no primes.
If I decide to bump that 1.5 million range up to a higher value, I'm sure that
the same situation will apply. And if I were a decent mathematician, I
might even calculate (given the slope of the slowest-descending straight ratio
line) the X-axis intercept point -- which would say exactly where on
the number scale that prime-free region resides.
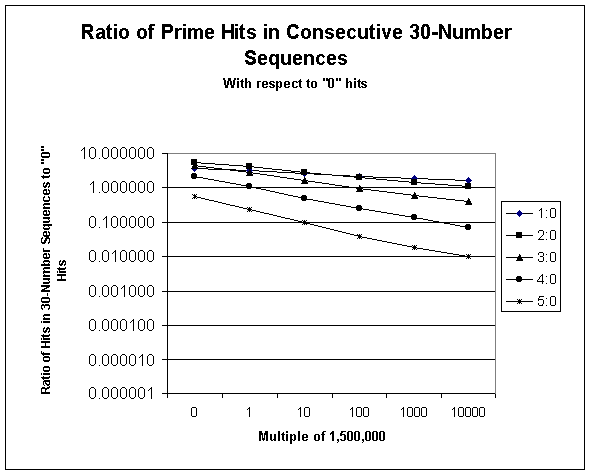
But wait a minute, not so fast. I cheated on the logarithmic graph
shown above. The bottom line showing "0.00" is not really zero, but
rather "0.001". (You can't plot a log graph with a zero on the y-axis.)
I didn't show enough of the significant digits of the Y-axis numbers.
The true situation is as follows:

Based on this piece of information, I'm not really convinced that the
sloping lines will ever hit true zero. This appears to me to be
somewhat like the paradoxes of Xeno: If a downward sloping line ever
does hit the "defined" X-axis, there will always be another lower number you
can plug into the Y-axis scale to give it another ramp to fall through.
(This is actually another way of showing that there are no "end" to the prime
numbers.)
But let's think about this some more. While we are talking about
ratios (very small ones, as we get out into the nether regions of numbers),
the original subject at hand was whole counts. If the ratios get
so small that they aren't reflective of the counts in question, then they
essentially become zero. For example, if the miniscule ratio is
extrapolated to be 1 "row hit" in one million (the lowest line on the above
log graph), and you are only talking about 50,000 total row counts in the
first place, then that axis line can certainly be considered "less than zero",
right? For 50,000 numbers, any ratio less than 0.00002 (equal to 1
row hit out of 50,000) is, for all intents and purposes, zero. So we
should set that Y-axis line as the point at which zero prime hits is achieved.
So I've managed (at 6:13 am, after a long night of thinking) to salvage my
original project. There are truly large (at least 1,500,000 long)
prime-free regions, somewhere out there in the stratospheric areas of the
number series. I would shout for joy, would it not be for the fear of
waking up Chris...
Back to Prime Number Explorations...
While the frequency of primes diminishes as the numbers get higher, they
never quit. Euclid proved that there are infinitely many prime numbers.
Furthermore, Carl Friedrich Gauss (in 1792) showed that the quantity of primes
less than the number n can be approximated by the function n/log
n.
He was only fifteen at the time. Smart kid! Looked at another way,
if you pick a number at random between 0 and n, the odds of it being prime are
about 1/log n.
I referred to diagonal "factor sieve lines" above. The
selection of the table modulus (30 wide) was not arbitrary on my part.
If you establish the table width as a multiplicand of the first few primes,
then the subsequent "prime-active" columns become vertical. If you think
about this, it makes sense. In this case, 30=2X3X5. Every 2nd
column is divisible by 2, every 3rd column by 3 and every 5th column by 5.
That leaves only 8 columns out of the 30 that can potentially be prime.
But since the next prime factor, 7, doesn't divide evenly into 30, its
multiplicands aren't arranged in a vertical row, but rather in a diagonal
fashion. You can identify those 7-factorable cells by doing a "knight's
move", beginning with the 7-factorable numbers in the first row -- 7,
14, 21, or 28. If you move down one and left two from any of those cells,
you'll run into a number divisible by 7. Alternately, you can go
the other way, one down and 5 right to establish the same diagonal lines. All the multiplicands of
other, higher prime factors can also be plotted on their own unique diagonal
"sieve lines". (For example, for the next prime factor
11, an 11-divisible number is found on the diagonal defined by going one down
and 8 left from any number divisible by 11, or one down and 3 right, whichever
you prefer.) I think it's the "7" factor sieve lines that foil
any chance of having all 8 "prime-active" columns in this mod-30 table from
being lit up. How to prove that, I leave to "real" math folks. If
you imagine all these countless "sieve lines" running through the table, you
can begin to appreciate that the prime numbers represent the "holes" in the
overall factoring net -- in this sense, they are defined as what they
aren't, rather than what they are -- the
nothingness embedded in the somethingness. And that is
why I'm drawn to them!
In case you were wondering, the frequency of primes found in
any of the 1st, 7th, 11th, 13th, 17th, 19th, 23rd, or 29th
"prime-live" columns in this 30-mod table is exactly the same as in any other
of the "prime-live" columns. That is, the distribution of primes across
these columns is absolutely flat. So it's no real surprise, given young
Master Gauss's finding, that each of the above ratio lines obeys a
logarithmic "declining" pattern. Any one of these "prime-rich" columns
simply recapitulates the situation you would get with a table only one
column wide, containing all the whole numbers listed in it
sequentially. The frequency of primes in 10X-sequential large segments of a
mod-1 table should also obey a straight logarithmic function like the lines
shown above. (It does -- I just this minute verified it.)
My aching brain doesn't want to do the math required to calculate the exact
X-axis intercept (i.e., with Y=0.00002) on a log scale, using the lowest
sloping line in my above graph. However, by just projecting the straight
lines on an extended chart like the one above, I would reckon that my
1,500,000 consecutive prime-free region begins at around N=1056,
or:
100,000,000,000,000,000,000,000,000,000,000,000,000,000,000,000,000,000,000
This isn't too awfully far off from the total number of
atoms contained in the Universe, which has been estimated at 1063.
Alas, I don't have several lifetimes to devote to verifying my N projection
using
my PC. While that number might seem pretty large, it pales to
insignificance in the world of "largest primes discovered". In March
2005, a prime
number was discovered (a "Mersenne Prime") that was 225,964,951-1.
It has 7,816,230 digits, and if printed out in its entirety, would fill 235
newspaper pages! I think prime numbers must truly be very sparse out in
that neighborhood...
